During any big election, you will see two numbers that seem to say the same thing but do not. A poll says "52% support"; a prediction market says "71% to win". People treat them as rivals — which one is right? — when they are answering different questions entirely. A poll measures opinion right now; a market prices the probability of an outcome. Confusing the two is how you end up shocked on election night by a result that was never as unlikely as the headline poll suggested.
Prediction markets are one of the clearest lenses on this, which is why we cover them across the prediction markets learn hub. This guide settles the prediction markets vs polls question honestly: what each one actually measures, when to trust which, and why reading them together beats picking a side.
TL;DR
- A poll measures stated opinion in a sample at a moment in time. A prediction market prices the probability of a final outcome, with money behind it.
- Polls answer "who is ahead today?"; markets answer "who will win?" — and turning the first into the second requires assumptions polls do not make.
- Markets aggregate polls plus everything else — turnout, momentum, fundamentals — and update continuously as new information arrives.
- Polls have a margin of error and can be systematically biased; markets can be overconfident or moved by sentiment and thin liquidity.
- Neither is a crystal ball. The strongest read uses polls as an input and the market's calibrated probability as the summary.
What a poll actually measures
A poll is a snapshot of opinion. It asks a sample of people a question and reports the result, with a margin of error reflecting sample size. That is genuinely valuable — it is direct evidence about what people currently think — but it comes with limits baked in.
A poll measures now, not the outcome. "52% support today" is not "52% chance of winning", because the election is not held today, opinion moves, and winning depends on turnout, distribution (you can lead the popular vote and lose the seats or the electoral college), and undecided voters breaking one way. A poll also carries systematic error that its margin of error does not capture: if a certain kind of voter is consistently harder to reach or less likely to answer honestly, every poll can lean the same wrong way at once. And a single poll is noisy; even a polling average is a measurement of opinion, not a forecast of the result.
None of this makes polls bad. It makes them an input — a strong one — rather than a probability.
What a prediction market actually measures
A prediction market prices the probability of a defined outcome by letting people trade contracts that pay out if it happens. The price is the crowd's money-weighted estimate of the odds — the mechanic we unpack in how prediction market probabilities work.
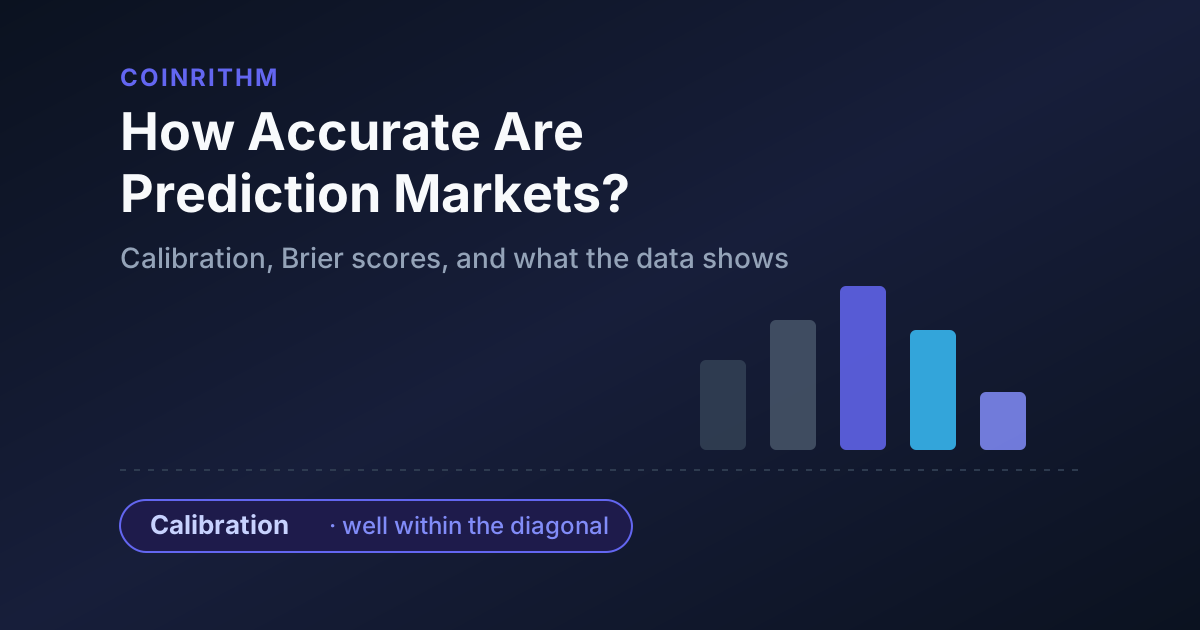
The market's advantage is what goes into that number. It does not just reflect polls; it reflects polls and the trader's read on turnout, momentum, fundamentals, history, and every rumour and data release — all continuously, in real time. When news breaks, a poll takes days to re-field; a market reprices in seconds. And because being wrong costs money, participants have an incentive to correct prices that drift from reality, which is why deep markets tend to be well-calibrated: their 70% really does win about 70% of the time, a property we measure in how accurate are prediction markets.
The market's weaknesses are the mirror image. It can be overconfident, herding toward a favourite. It can be moved by sentiment rather than information, especially in thin or low-quality markets where a few dollars swing the price — the reason our data-quality layer flags markets you should not lean on. And its participants are not a representative sample of anything; they are people willing to bet, whose biases can differ from the electorate's.
Why they disagree — and why that is useful
When a market and the polls diverge, it is usually not because one is broken. It is because the market has folded in something the polls cannot.
A poll showing a dead heat can sit alongside a market at 70% because the market is pricing in an incumbency advantage, a favourable map, a turnout edge, or a pattern of that candidate outperforming their polls. Sometimes the market is reading real signal the polls miss. Sometimes it is overreacting to momentum and the polls are the sober voice. The gap itself is the information: it tells you exactly where the disagreement lives, so you can go find out why. This is the same instinct we apply across venues in probability divergence — a difference between two honest estimates is a question, not a contradiction.
What you should not do is assume the market is automatically right because it has money behind it. Money makes markets harder to fool, not impossible; markets have been confidently wrong. The discipline is to treat the market's number as a well-tested probability and the polls as the raw opinion feeding into it.
How to read both together
The strongest approach is not to choose. Use polls for what they are good at — direct, granular evidence about opinion and its movement — and use the market for what it is good at — a single, continuously updated, money-tested probability of the actual outcome.
In practice: watch the polling average to understand the state of opinion and its trend, then read the market for the probability that state translates into a win. When they agree, you have a confident read. When they diverge, you have found the exact thing worth investigating — and you should resist the urge to collapse the uncertainty prematurely. Above all, remember that a market at 71% is telling you the underdog wins nearly three times in ten; treating that as a foregone conclusion is one of the most common prediction market mistakes.
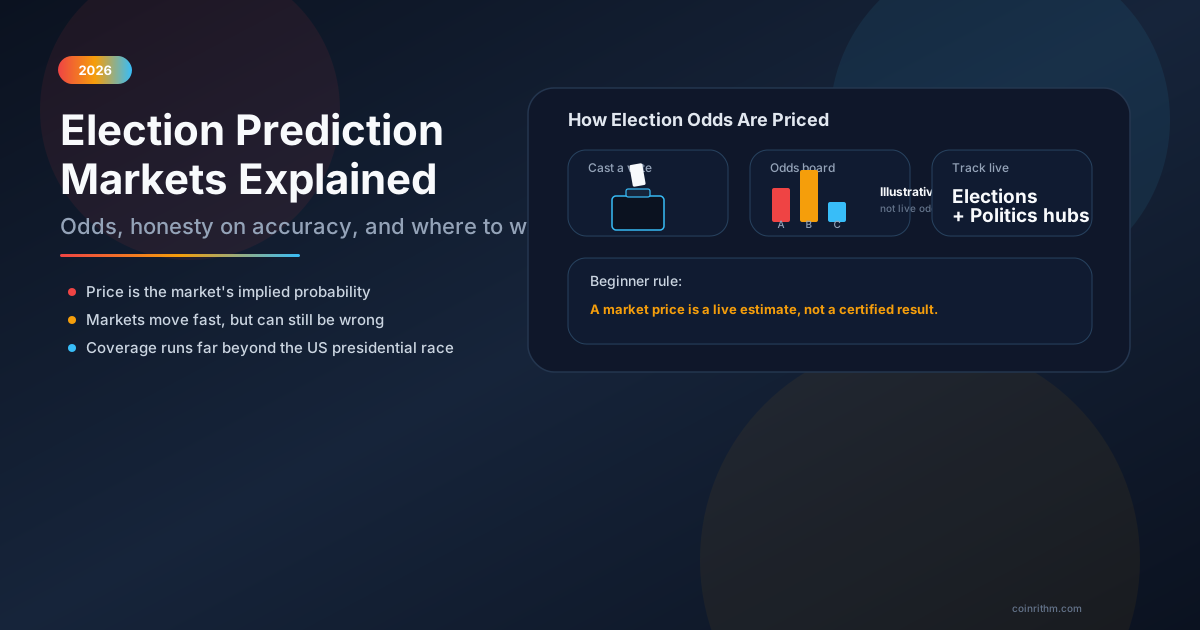
On CoinRithm you can watch election and event markets update in real time on the prediction markets hub, see where venues agree or disagree on the compare view, and read more about the category in election prediction markets.
FAQ
Are prediction markets more accurate than polls?
Often, especially closer to an event and in the aggregate, because markets fold in polls plus turnout, momentum, and fundamentals, update continuously, and put money behind conviction. But "more accurate" is not "infallible" — markets can be overconfident or moved by sentiment, so the honest answer is that a well-calibrated market is usually the better summary probability, while polls remain the better raw evidence.
Why do prediction markets and polls show different numbers?
Because they measure different things. A poll reports opinion in a sample today; a market prices the probability of the final outcome, incorporating turnout, the electoral map, momentum, and history. A poll at 50-50 can coexist with a market at 70% because the market is pricing factors beyond current opinion.
What is a poll's margin of error, and do markets have one?
A poll's margin of error reflects sampling — how much the result might vary purely because it surveyed a sample rather than everyone — and it does not capture systematic bias. Markets do not have a margin of error in that sense, but they have their own uncertainty: overconfidence, sentiment swings, and thin liquidity, which is why we score market accuracy through calibration instead.
Should I just trust the prediction market and ignore polls?
No. Money makes markets harder to fool, not impossible, and they have been confidently wrong before. The best read uses polls as a strong input about opinion and the market as a continuously updated, calibrated probability of the outcome — and treats any large gap between them as something to investigate rather than resolve by picking a side.
Which is better for elections specifically?
For a single summary probability of who will win, a deep, well-calibrated market is usually the cleaner number. For understanding why — which groups are moving, by how much — polls are irreplaceable. Read them together: polls for the story, the market for the odds. See our election prediction markets guide for more.